
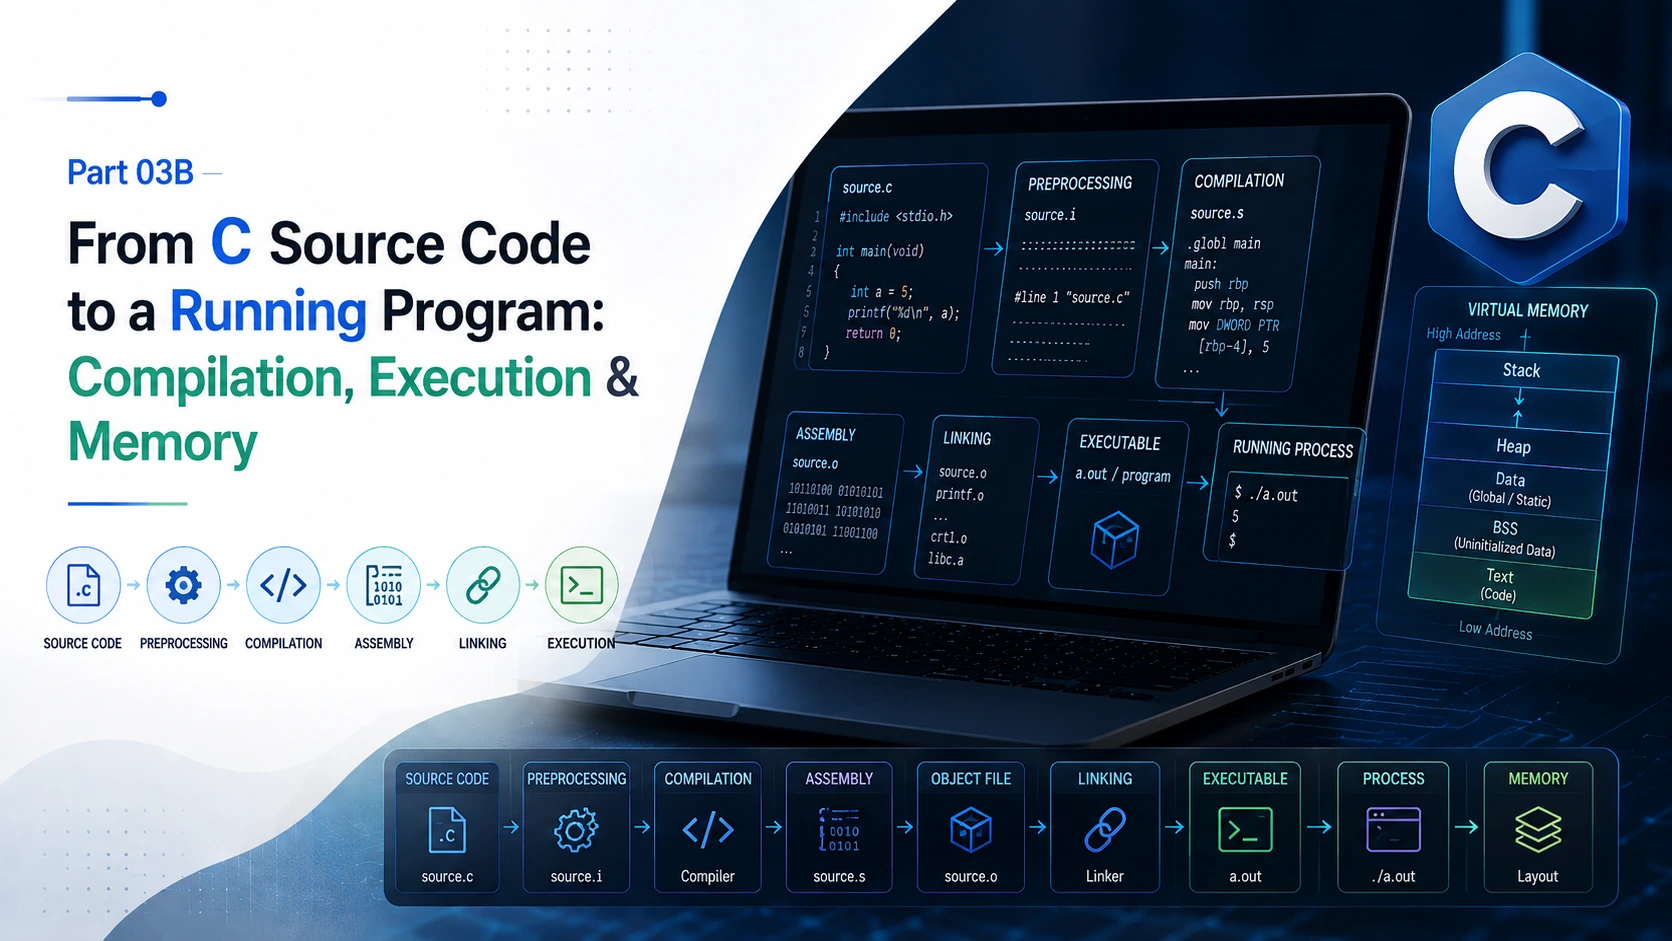
Compilation, Execution, Processes, Virtual Memory and Memory Management
In Part 03, we learned how a C program is structured, what statements do, how variables store values, how functions work, and how input and output move through a program.
But there is a deeper question:
What actually happens between writing a .c file and seeing the program run?
When you write:
printf("Hello World\n");the computer does not directly understand that line as a C statement and execute it.
There is a complete journey between your source code and a running program.
That journey involves:
- preprocessing
- compilation
- assembly
- linking
- executable files
- operating-system processes
- virtual memory
- physical memory
- addresses
- CPU instructions
- memory permissions
- stack and heap
- dynamically allocated memory
- and, when something goes wrong, operating-system error handling and debugging
Part 03 introduced the basic idea of the compilation pipeline.
This part goes one level deeper.
The goal is not to turn this article into a compiler-engineering textbook. The goal is to build a mental model strong enough that when you later learn pointers, memory allocation, structures, files, debugging or systems programming, these concepts already make sense.
The Complete Journey of a C Program
At the highest level, the journey looks like this:
C Source Code
     ↓
Preprocessing
     ↓
Compilation
     ↓
Assembly
     ↓
Object File
     ↓
Linking
     ↓
Executable File
     ↓
Operating System
     ↓
Running Process
     ↓
Virtual Memory
     ↓
CPU + Memory + Operating System
GCC normally performs preprocessing, compilation, assembly and linking when invoked to build a program. Its -E, -S and -c options allow you to stop at intermediate stages.
This distinction is extremely important:
An executable file is not the same thing as a running program.
An executable is a file stored somewhere.
A running program is a process managed by the operating system.
We will build this distinction step by step.
What You Actually Write
Suppose we create:
#include <stdio.h>

int main(void)
{
    printf("Hello World\n");
    return 0;
}
and save it as:
main.cAt this point, we have only written source code.
The file contains human-readable instructions written using the C language.
The CPU cannot directly execute C syntax such as:
printf("Hello World\n");The source code must first be translated into a form that the target machine can execute.
Preprocessing
The first major stage is preprocessing.
For example:
#include <stdio.h>is a preprocessing directive.
The preprocessor handles tasks such as:
- processing
#include - expanding macros
- processing conditional compilation directives
- preparing the source for the compiler
You can ask GCC to stop after preprocessing:
gcc -E main.c -o main.iNow you have:
main.iThis is preprocessed C source.
It is still C-like source code. It is not machine code.
What happened?
Conceptually:
main.c
   ↓
Preprocessor
   ↓
main.i
The important idea is:
The preprocessor prepares the source code before the actual C compilation stage begins.
Compilation
The next stage is the compiler proper.
The compiler analyses the C source and translates it toward the target architecture.
This involves much more than simply “changing C into assembly.”
The compiler has to understand:
- syntax
- types
- expressions
- control flow
- functions
- declarations
- optimisation opportunities
- target architecture rules
For example:
int x = 10;
int y = 20;
int result = x + y;
must eventually become operations that the target processor understands.
GCC can stop after the compilation stage with:
gcc -S main.c -o main.sThis produces an assembly source file:
main.sGCC documents -S as stopping after compilation and producing assembler code.
Conceptually:
main.c
   ↓
Preprocessing
   ↓
Compiler
   ↓
main.s
Assembly
Assembly language is much closer to the actual instruction set of the processor.
The assembler converts assembly instructions into machine-level object code.
You can ask GCC to stop before linking:
gcc -c main.c -o main.oThis produces:
main.oThe .o file is an object file.
It contains machine-oriented code and other information needed later by the linker.
GCC's -c option compiles or assembles the source but does not perform the linking stage.
So now the journey is:
main.c
   ↓
main.i
   ↓
main.s
   ↓
main.o
The exact contents of these files depend on the compiler, target architecture, compiler version, options and source code.
Therefore, you should treat generated assembly and binary output as environment-specific observations, not universal output.
Linking
Now we reach a stage that beginners often overlook.
Your program may use functions that are not implemented inside your source file.
For example:
printf("Hello World\n");Your program refers to printf, but your main.c file does not contain the implementation of printf.
The linker resolves such references and combines the required pieces into the final executable according to the platform and build configuration.
For example:
gcc main.o -o programNow we have:
programwhich is the executable file.
Conceptually:
main.o
   +
required linked components
   ↓
program
The exact details depend on whether libraries are statically or dynamically linked, the platform, compiler options and executable format.
One Experiment That Lets You See the Pipeline
Instead of only reading about the process, inspect it.
Create:
#include <stdio.h>

int main(void)
{
    printf("Hello World\n");
    return 0;
}
Save it as:
main.cThen run:
gcc -E main.c -o main.iYou can inspect:
less main.iThen:
gcc -S main.c -o main.sInspect:
less main.sThen:
gcc -c main.c -o main.oAnd finally:
gcc main.o -o programRun it:
./programYou have now manually observed the major stages of the build process.
A useful mental model is:
main.c
  │
  ├── gcc -E ──→ main.i
  │
  ├── gcc -S ──→ main.s
  │
  ├── gcc -c ──→ main.o
  │
  └── gcc main.o ──→ program
This is much more useful than memorising four commands without understanding why they exist.
Executable File vs Running Process
This distinction deserves special attention.
Suppose you have:
programon your disk.
That file is not yet a running program.
When you execute:
./programthe operating system creates a process and prepares the program to run.
Conceptually:
Executable file
       ↓
Operating System
       ↓
Running process
The executable is persistent data stored in the filesystem.
The process is a live execution environment.
A process has things such as:
- virtual address space
- CPU execution state
- stack
- memory mappings
- loaded code
- data
- heap
- operating-system-managed resources
This distinction becomes extremely important when we start discussing memory.
What Is a Process?
A process can be thought of as:
A program in execution, together with the resources and execution state managed for it by the operating system.
For example, when you run:
./programLinux assigns the process a process ID, commonly called a PID.
You may see something such as:
My PID is: 4812The exact number will be different on every run.
A PID is simply an identifier used by the operating system to refer to that process.
Where Does the Program Live While It Is Running?
This is where the concept of memory becomes more interesting.
A running process does not simply receive “one big piece of RAM.”
Modern operating systems normally provide each process with a virtual address space.
The addresses used by the program are virtual addresses.
The operating system and hardware cooperate to map those virtual addresses to physical memory.
A simplified model looks like this:
C Program
   ↓
Process
   ↓
Virtual Address Space
   ↓
MMU + Page Tables
   ↓
Physical Memory
Virtual Memory
Imagine your program accesses an address:
0x7fffffffd000That does not necessarily mean that the physical RAM chip has a byte permanently sitting at that exact address.
The number belongs to the process's virtual address space.
The hardware's Memory Management Unit (MMU) translates virtual addresses using page tables maintained by the operating system.
A simplified view:
Virtual Address
      ↓
     MMU
      ↓
  Page Tables
      ↓
Physical Address
      ↓
     RAM
This abstraction allows the operating system to provide each process with its own address-space view and to control which memory regions are accessible.
Linux also exposes information about a process's virtual mappings through /proc/<pid>/maps.
Pages and Page Tables
Virtual memory is normally managed in units called pages.
A page is a fixed-size block of virtual memory.
The exact page size depends on the architecture and operating-system configuration. A common size on many systems is 4096 bytes, but it should not be treated as a universal rule.
A page table records information needed to translate virtual pages to physical memory or other backing.
Conceptually:
Virtual Page
      │
      ↓
Page Table Entry
      │
      ├── Physical frame
      ├── Present / not present
      ├── Permissions
      └── Other control information
Linux provides /proc/<pid>/pagemap for information about the mapping of virtual pages to physical page frames or swap space, subject to access restrictions.
You do not need to learn page-table bit layouts at this stage.
The important concept is:
A C pointer contains an address used by the program. The hardware and operating system determine how that virtual address is mapped.
That idea becomes extremely important when you later learn pointers in depth.
What Is Actually Stored in Memory?
Consider:
int age = 21;At a conceptual level, the program now has an object named:
ageThat object has:
- a type
- a stored value
- a location in memory
- a lifetime
- a scope
The value is:
21The type is:
intThe object occupies some amount of storage determined by the implementation.
You can inspect its size using:
printf("%zu\n", sizeof(age));The result is implementation-dependent.
This is one reason you should not learn C by assuming:
int = always 4 bytes
char = always 1 byte
pointer = always 8 bytes
Some environments commonly have those sizes, but C itself does not make all of those assumptions universally true.
Value vs Address
Suppose:
int age = 21;There are two different ideas:
Value:
21
and:
Address:
where the object age is stored
C allows you to obtain an object's address using:
&ageFor example:
printf("%p\n", (void *)&age);The exact address may change every time the program runs.
That is normal.
Modern systems commonly use address-space randomisation and other mechanisms, so you should not expect a fixed address.
Why scanf() Uses &age
Now something from Part 03 becomes much easier to understand.
Consider:
int age;

scanf("%d", &age);
Why do we write:
&ageinstead of:
ageBecause scanf needs a location where it can store the input value.
Conceptually:
User enters:
25

        ↓

scanf()

        ↓

address of age

        ↓

memory occupied by age

        ↓

age becomes 25
This is one of the first practical places where a beginner sees the difference between:
valueand:
addressLater, pointers will turn this idea into a central part of C programming.
Looking Inside a Running Linux Process
Now we can make the virtual-memory concept visible.
The following demonstration is Linux-specific.
Create:
#include <stdio.h>
#include <unistd.h>

int main(void)
{
    printf("My PID is: %d\n", getpid());
    getchar();

    return 0;
}
Compile:
gcc memory_map.c -o memory_mapRun:
./memory_mapYou may see:
My PID is: 4812The program waits at:
getchar();This gives you time to inspect the process from another terminal.
Run:
cat /proc/4812/mapsReplace 4812 with the PID shown by your program.
Linux's /proc/<pid>/maps interface shows currently mapped memory regions and their permissions. It can also identify mappings such as [heap] and [stack].
A representative output may contain entries resembling:
00400000-00401000 r--p ... ./memory_map
00401000-00402000 r-xp ... ./memory_map
...
00600000-00601000 rw-p ... ./memory_map
...
01a00000-01a21000 rw-p ... [heap]
...
7ffd12345000-7ffd12366000 rw-p ... [stack]
Do not expect these exact addresses.
They are only representative.
The important information is the pattern.
You may see:
[heap]and:
[stack]along with executable and other memory mappings.
What Does r-xp Mean?
A mapping such as:
r-xpcontains permission information.
Linux documents the permission characters as:
r = read
w = write
x = execute
and the mapping can also indicate whether it is shared or private.
So a region marked:
r-xpis readable and executable, but not writable through that mapping.
This becomes important because modern systems do not simply treat all memory as:
“everything can be read, written and executed.”
Different regions can have different permissions.
Program Memory Is Not One Simple Block
A simplified process memory model may look like:
High Addresses
┌──────────────────────────────┐
│ Stack                        │
│ local data / call frames    │
│                              │
│            ↓                 │
│                              │
│                              │
│            ↑                 │
│ Heap                        │
│ dynamically allocated data  │
│                              │
├──────────────────────────────┤
│ Global / Static Data         │
├──────────────────────────────┤
│ Read-only Data               │
├──────────────────────────────┤
│ Program Code                 │
└──────────────────────────────┘
Low Addresses
This diagram is a conceptual model, not a universal physical layout.
Real process address spaces contain many more mappings, including shared libraries, loaders, anonymous mappings, memory-mapped files and operating-system-specific regions.
Linux's /proc/<pid>/maps makes those mappings visible.
Stack and Heap — The Basic Difference
Two names appear frequently when learning C:
Stack
Heap
They describe different kinds of storage used by a running program.
Stack
The stack is commonly associated with:
- function calls
- automatic local objects
- call frames
- function parameters and related execution state
For example:
void test(void)
{
    int x = 10;
}
x has automatic storage duration because it is an ordinary local object with block scope.
Heap
The heap is associated with dynamically allocated storage.
For example:
int *p = malloc(sizeof *p);The storage obtained from malloc remains allocated until it is released.
free(p);The important distinction is:
Stack-based automatic storage is tied to program execution flow, while dynamically allocated storage is explicitly managed through allocation and deallocation functions.
The exact implementation of stack and heap layout is platform-dependent.
The Four Storage Durations in C
| Storage Duration | Basic Idea |
|---|---|
| Automatic | Ordinary local block-scope objects whose lifetime is tied to entering and leaving their block |
| Static | Storage that persists for the entire program execution |
| Thread | Storage whose lifetime is tied to the lifetime of a thread |
| Allocated | Storage obtained dynamically at runtime, such as through malloc() |
Storage duration and storage location are related concepts, but they are not the same thing.
For example, saying:
“Every automatic object is always on the stack.”
is too strong as a C-language statement.
A compiler may optimise an object into a register or otherwise represent it differently as long as the observable behaviour required by the language is preserved.
This distinction matters when moving from C concepts to implementation details.
Static Storage and Program Data
Consider:
int global_counter = 10;

static int file_counter = 20;
These objects have static storage duration.
They exist throughout the execution of the program.
Depending on their initialization and the implementation, related data may appear in sections such as:
.data
.bss
when inspecting a typical ELF executable.
But remember:
.data and .bss are properties of a particular object-file/executable format and toolchain environment, not C language keywords.
Looking Inside the Executable
Now we can inspect the executable itself.
Compile:
gcc main.c -o programThen:
readelf -S programThe -S / --sections option displays ELF section headers.
You may see sections with names such as:
.text
.rodata
.data
.bss
Their exact arrangement and additional sections depend on the compiler, linker, platform and build options.
A simplified explanation is:
.text
Typically contains executable program code.
.rodata
Typically contains read-only data such as constants and string literals.
For example:
printf("Hello World\n");contains a string literal that may be placed in a read-only data section in a typical ELF build.
.data
Typically contains initialized writable global/static data.
For example:
int counter = 10;may contribute to writable initialized data.
.bss
Typically represents zero-initialized or uninitialized static data.
For example:
int counter;at file/global scope may be represented through .bss.
Again, these descriptions are practical ELF/GCC concepts, not rules imposed by the C language itself.
size Gives Another View
You can also inspect section sizes with:
size -A -d programThis gives another view of the sizes of sections in the executable.
The purpose of this experiment is not to memorise section names.
It is to connect three things:
C Source
   ↓
Compiler / Linker
   ↓
Executable Sections
You wrote:
int counter = 10;and the toolchain transformed your source into a binary representation with code and data arranged into sections appropriate for the target format.
That is a much stronger understanding than simply saying:
“The compiler creates an executable.”
String Literals and Read-Only Data
Consider:
printf("Hello World\n");The text:
Hello Worldis a string literal.
It is not a writable character array created by your program in the same way as:
char text[] = "Hello World";These two declarations are different concepts.
For example:
char text[] = "Hello World";creates an array whose elements can be modified.
Whereas a string literal has implementation-defined placement and must not be modified through a pointer.
This distinction becomes especially important when you start working with:
- character arrays
- pointers
- strings
- memory permissions
Dynamic Memory — When Storage Is Requested at Runtime
So far, most of the examples have used objects whose storage is associated with declarations.
C also allows a program to request storage dynamically.
For example:
#include <stdio.h>
#include <stdlib.h>

int main(void)
{
    int *p = malloc(sizeof *p);

    if (p == NULL)
    {
        printf("Memory allocation failed.\n");
        return 1;
    }

    *p = 42;

    printf("Value = %d\n", *p);

    free(p);
    p = NULL;

    return 0;
}
Here:
malloc(sizeof *p)requests dynamically allocated storage.
If allocation succeeds, p receives a pointer to that storage.
If allocation fails, malloc returns a null pointer, so production-quality code should handle that possibility.
After the storage is no longer needed:
free(p);releases it.
Why free(p); p = NULL; ?
You may often see:
free(p);
p = NULL;
The first statement releases the dynamically allocated storage.
The second statement changes the pointer variable so that it no longer contains the old address.
This is a useful defensive programming practice.
However, there is an important distinction:
free(p);
p = NULL;
does not magically make an invalid pointer access safe.
After:
free(p);the old allocation is no longer yours to access.
Setting it to NULL reduces the chance of accidentally reusing that stale value through the same pointer variable.
It does not make this safe:
free(p);
p = NULL;

printf("%d\n", *p);
Dereferencing a null pointer is not valid C behaviour.
Likewise, using a pointer after its allocated storage has been freed is undefined behaviour. free(NULL) itself is defined to do nothing, which is one reason resetting a pointer to NULL can make later cleanup logic safer.
Dynamic Memory Has a Lifecycle
A useful way to think about dynamic memory is:
Request
   ↓
Allocation
   ↓
Check success
   ↓
Use storage
   ↓
Stop using storage
   ↓
free()
   ↓
Do not access the released storage
The important responsibility is not merely:
“Use malloc.”
It is:
Manage the complete lifetime of dynamically allocated storage correctly.
malloc, calloc and realloc
C provides several dynamic allocation functions.
malloc
Requests a block of memory.
int *p = malloc(10 * sizeof *p);calloc
Requests storage for multiple elements and initializes the allocated bytes to zero.
int *p = calloc(10, sizeof *p);realloc
Changes the size of an existing allocation.
p = realloc(p, 20 * sizeof *p);realloc requires special care because a failed reallocation can leave the original allocation available.
A safer pattern is:
int *temp = realloc(p, new_size);

if (temp != NULL)
{
    p = temp;
}
The exact allocation behaviour is implementation-dependent, but the ownership rule is simple:
If your program successfully owns dynamically allocated storage, it must eventually release that storage when it is no longer required.
Common Dynamic-Memory Problems
Dynamic memory gives C enormous flexibility, but it also gives the programmer responsibility.
Memory Leak
Memory is allocated but never released.
malloc()
   ↓
storage used
   ↓
program loses the pointer
   ↓
storage cannot be released
Repeated leaks can increase a process's memory consumption.
Dangling Pointer
A pointer still refers to storage that has already been released.
int *p = malloc(sizeof *p);

if (p != NULL)
{
    *p = 10;
    free(p);
    p = NULL;
}
Without resetting p, the variable could still contain the old address.
Double Free
The same allocation is released more than once.
free(p);
free(p);
This is invalid.
Out-of-Bounds Access
The program accesses memory outside the valid range of an object or allocated block.
For example:
int values[5];

values[5] = 100;
Valid indexes are:
0
1
2
3
4
values[5] is outside the array.
This kind of bug can cause anything from incorrect data to a crash or other undefined behaviour.
Stack Memory in Practice
Consider:
void function(void)
{
    int x = 10;
}
When the function executes, the implementation needs storage associated with x.
A typical implementation may use the stack for such automatic storage.
But C does not require every automatic object to physically live on a stack.
The compiler may optimise values into registers or remove storage entirely when the observable behaviour permits it.
This is why the correct mental model is:
Automatic storage duration describes the lifetime of an object, not a guaranteed physical memory location.
Seeing Stack and Heap Mappings Live
Return to the Linux experiment.
Run the program:
#include <stdio.h>
#include <unistd.h>

int main(void)
{
    int local = 42;

    printf("PID: %d\n", getpid());
    printf("Local variable address: %p\n", (void *)&local);

    getchar();

    return 0;
}
Compile:
gcc memory.c -o memoryRun:
./memoryThen inspect:
cat /proc/<PID>/mapsYou can identify mappings such as:
[heap]
[stack]
and the executable's mapped regions. Linux documents these mappings directly through /proc/<pid>/maps.
The address printed for local should fall within the process's virtual address space.
This gives you a practical connection:
C object
   ↓
Address
   ↓
Process virtual address space
   ↓
Memory mapping
A Small Stack-Growth Experiment
You can also experiment with addresses of local variables in nested function calls.
For example:
#include <stdio.h>
#include <stdint.h>

void level3(void)
{
    int c = 30;

    printf("level3: %p\n", (void *)(uintptr_t)&c);
}

void level2(void)
{
    int b = 20;

    printf("level2: %p\n", (void *)(uintptr_t)&b);
    level3();
}

void level1(void)
{
    int a = 10;

    printf("level1: %p\n", (void *)(uintptr_t)&a);
    level2();
}

int main(void)
{
    level1();
    return 0;
}
On a typical Linux x86-64 system, you may observe addresses that appear to move in a consistent direction as calls become deeper.
But do not turn that observation into a C rule.
The exact address relationship is implementation- and ABI-dependent.
The useful lesson is:
Function calls create execution state, and automatic objects can be associated with that state. The exact physical arrangement is determined by the compiler, architecture and runtime environment.
What Happens When Memory Access Goes Wrong?
Now we reach one of the most useful connections between C and the operating system.
Consider:
int *p = NULL;

printf("%d\n", *p);
The program attempts to access memory through a null pointer.
Or consider an invalid pointer:
int *p = (int *)0x1234;

printf("%d\n", *p);
The program is asking the CPU to access an address that may not be valid for the process.
What happens next is not simply:
“C gives an error.”
C itself does not provide a standard runtime exception mechanism for this kind of invalid memory access.
Instead, the CPU, MMU and operating system become involved.
Page Fault Does Not Automatically Mean Segmentation Fault
This distinction is important.
When a CPU attempts to access a virtual page, the MMU may discover that the required translation or permission is not currently available.
This can result in a page-fault exception.
But a page fault does not automatically mean that the program has made an invalid access.
Operating systems use page faults for legitimate purposes such as:
- demand paging
- loading memory pages
- handling copy-on-write
- other virtual-memory mechanisms
So:
Page faultdoes not simply mean:
Segmentation faultInstead, the operating system examines why the fault occurred.
If the access cannot legally be satisfied, the operating system may terminate the process or deliver an appropriate signal.
On Linux, an invalid user-space memory access can result in:
SIGSEGVwhich is commonly reported as a segmentation fault.
The important chain is therefore:
Invalid memory access
        ↓
CPU detects memory-access problem
        ↓
Page-fault handling
        ↓
Operating system examines the situation
        ↓
Invalid access cannot be satisfied
        ↓
SIGSEGV may be delivered
        ↓
Program terminates
This is much more accurate than saying:
Page fault = segmentation faultA Practical Segmentation-Fault Experiment
Create:
#include <stdio.h>

int main(void)
{
    int *p = NULL;

    printf("About to access invalid memory...\n");

    *p = 42;

    return 0;
}
Compile with debugging information:
gcc -g segfault.c -o segfaultRun:
./segfaultOn a typical Linux environment, you may see something similar to:
About to access invalid memory...
Segmentation fault
The exact wording and behaviour of the shell environment may differ.
Debugging the Crash with GDB
Now we can investigate instead of simply observing the crash.
Start:
gdb ./segfaultInside GDB:
runWhen the program stops because of the invalid access, run:
btbt is the GDB alias for backtrace.
A backtrace shows the current stack frames and the function-call path that led to the point where execution stopped.
A representative backtrace may resemble:
#0 main () at segfault.c:7The exact line number depends on the source file.
This is powerful because instead of asking:
“Why did my program crash?”
you can begin asking:
“Which function was executing, which line was active, and what call path brought the program here?”
That is how debugging becomes systematic.
The Relationship Between C, the CPU and the OS
At this point, we can connect several ideas.
When you write:
*p = 42;there are several layers involved:
C source code
     ↓
Compiler-generated machine instructions
     ↓
CPU executes instruction
     ↓
CPU requests memory access
     ↓
MMU checks virtual address translation
     ↓
Page tables / permissions are involved
     ↓
Operating system handles faults when required
C gives you the programming model.
The compiler translates that model.
The CPU executes the resulting instructions.
The MMU manages address translation and memory permissions.
The operating system manages the process and responds to exceptional situations.
This is one of the central ideas behind systems programming.
Multiple C Files
Real programs are rarely contained in one .c file.
Imagine:
main.c
math.c
math.h
math.h might contain declarations:
int add(int a, int b);math.c might contain the definition:
int add(int a, int b)
{
    return a + b;
}
main.c can include the header:
#include "math.h"and call:
int result = add(10, 20);You can compile the files separately:
gcc -c main.c -o main.o
gcc -c math.c -o math.o
Then link them:
gcc main.o math.o -o programNow the structure becomes:
main.c ──→ main.o ──┐
                     ├──→ linker → program
math.c ──→ math.o ──┘
This is one of the reasons the object-file stage matters.
A large program can be divided into separate translation units and then combined during linking.
Header Files and Source Files
A common beginner misconception is:
“The .h file contains the implementation.”
Not necessarily.
A header commonly provides declarations, types, macros and interfaces that other source files can use.
For example:
int add(int a, int b);tells the compiler that a function named add exists with a particular interface.
The actual implementation may be somewhere else:
int add(int a, int b)
{
    return a + b;
}
The compiler and linker work together to make these separate pieces form a usable program.
This distinction becomes increasingly important as projects grow.
Compiler Errors Are Part of the Development Process
Consider:
int main(void)
{
    printf("Hello")
    return 0;
}
There is a missing semicolon.
The compiler may report an error.
The correct workflow is not:
Error → panicIt is:
Write
  ↓
Compile
  ↓
Read diagnostic
  ↓
Locate the relevant source line
  ↓
Understand the error
  ↓
Fix
  ↓
Compile again
Compiler diagnostics are one of the main tools used to communicate problems in source code.
Learning to read them is part of learning C.
Build Errors vs Runtime Errors
These two categories should not be confused.
Compile-time error
The source cannot be successfully translated.
Example:
int main(void)
{
    int x =
    return 0;
}
The compiler may reject it.
Link-time error
The source files may compile individually, but required symbols cannot be resolved during linking.
For example, you may call a function whose definition was never provided to the linker.
Runtime error or failure
The program successfully builds but encounters a problem while executing.
Examples include:
- invalid memory access
- failed file operation
- invalid input handling
- logic errors
The distinction is:
Compiler problem
      ≠
Linker problem
      ≠
Runtime problem
      ≠
Logic problem
Understanding which layer contains the problem makes debugging much faster.
Logic Errors Are Different Again
Suppose:
int a = 10;
int b = 20;

printf("%d\n", a - b);
The program may compile perfectly.
It may run perfectly.
It may even produce exactly what the CPU was instructed to produce.
But perhaps the programmer actually wanted:
a + bThat is a logic error.
There may be no compiler error and no crash.
The program is simply doing the wrong thing.
This is why debugging is not only about crashes.
A Complete Practical Mental Model
We can now connect everything we have learned.
You write:
main.cThe toolchain processes it:
Source Code
    ↓
Preprocessor
    ↓
Compiler
    ↓
Assembly
    ↓
Object File
    ↓
Linker
    ↓
Executable
Then the operating system loads the executable and creates a process:
Executable
    ↓
Operating System
    ↓
Process
The process receives a virtual address space:
Process
    ↓
Virtual Address Space
    ↓
Code
Read-only data
Writable data
Heap
Stack
Shared mappings
Other regions
The CPU executes instructions using virtual addresses.
The MMU and page tables participate in translating those addresses:
Virtual Address
       ↓
      MMU
       ↓
   Page Tables
       ↓
Physical Memory / Other Backing
Your C objects exist within this larger execution model.
For example:
int age = 21;gives the program an object with:
Type
Value
Storage
Lifetime
Scope
Then:
&ageallows the program to obtain the object's address.
Later, a pointer can store that address.
And:
malloc()allows the program to request dynamically allocated storage at runtime.
Finally:
free()releases dynamically allocated storage when it is no longer required.
What Memory Management Really Means
At a beginner level, “memory management” can sound like:
“Use malloc and free.”
That is far too narrow.
Memory management includes understanding:
- where objects exist
- how long they exist
- who owns dynamically allocated storage
- when storage becomes invalid
- how addresses are used
- how arrays occupy contiguous storage
- how pointers refer to objects
- how out-of-bounds access happens
- how memory leaks happen
- how dangling pointers happen
- how allocation failures are handled
- how the operating system protects process memory
C gives the programmer significant control over these areas.
That control is powerful.
It is also one of the reasons C requires careful programming.
Why Pointers Become Important
At this point, pointers should no longer feel like an isolated syntax topic.
We have already encountered:
&ageand:
scanf("%d", &age);We have seen:
valueand:
addressWe have seen:
virtual addressWe have seen:
memory mappingand:
dynamic allocationSo the next question naturally becomes:
How does C represent and manipulate these addresses?
That is where pointers become central.
Pointers are not simply “variables that store addresses.”
They become a mechanism for:
- referring to objects indirectly
- modifying data through another reference
- working with arrays
- passing data efficiently
- dynamically allocated memory
- strings
- structures
- linked data structures
- system interfaces
This is why pointers deserve their own serious treatment rather than being introduced as one more syntax rule.
What You Should Now Understand
Before moving deeper into C, you should be able to explain the following in your own words.
Source Code
A .c file contains C source code written by the programmer.
Preprocessing
The preprocessor handles directives such as:
#include
#define
#if
before the compiler proper processes the source.
Compilation
The compiler translates C into a lower-level representation suitable for the target architecture, commonly producing assembly when requested.
Assembly
The assembler converts assembly into an object file containing machine-oriented code and related information.
Linking
The linker combines object files and resolves required symbols to produce the final executable.
Executable
An executable is a file that the operating system can load and start.
Process
A process is a running instance of a program together with its execution state and operating-system-managed resources.
Virtual Memory
A process normally operates within a virtual address space rather than directly treating physical RAM as its complete address space.
MMU
The Memory Management Unit participates in translating virtual addresses and enforcing memory-access permissions.
Stack
The stack is commonly associated with function-call execution and automatic storage.
Heap
The heap is commonly associated with dynamically allocated storage.
Address
An address identifies a location in the process's address space.
Pointer
A pointer is an object capable of storing a pointer value that can refer to another object or function, subject to C's rules.
malloc()
Requests dynamically allocated storage.
free()
Releases dynamically allocated storage.
Memory Leak
Allocated storage remains unavailable for reuse because the program failed to release it appropriately.
Dangling Pointer
A pointer refers to storage whose lifetime has ended or which has otherwise become invalid to access.
Segmentation Fault
On systems such as Linux, an invalid memory access can result in a SIGSEGV signal and process termination. The underlying hardware/OS handling is more nuanced than simply “page fault equals segmentation fault.”
GDB Backtrace
A GDB backtrace shows the call stack that led to the current execution point or crash.
The Complete Picture
At the beginning of Part 03, a C program looked something like this:
#include
main()
{
    statements;
}
Now the picture is much larger:
                 C Source Code
                       │
                       ▼
                Preprocessing
                       │
                       ▼
                  Compilation
                       │
                       ▼
                    Assembly
                       │
                       ▼
                  Object File
                       │
                       ▼
                    Linking
                       │
                       ▼
                  Executable
                       │
                       ▼
                Operating System
                       │
                       ▼
                    Process
                       │
              ┌────────┴────────┐
              │                 │
              ▼                 ▼
       Virtual Address      CPU Execution
           Space                 │
              │                  │
              ▼                  │
          MMU + Page Tables ◄────┘
              │
              ▼
        Physical Memory
              │
       ┌──────┼──────┐
       │      │      │
      Code   Data   Runtime
                     │
              ┌──────┴──────┐
              │             │
            Stack          Heap
              │             │
        Automatic       Dynamic Storage
         Objects        malloc/calloc/
                        realloc/free
And when something goes wrong:
Invalid Access
      ↓
CPU / MMU detects a memory-access problem
      ↓
Operating-system fault handling
      ↓
Access cannot be legally satisfied
      ↓
SIGSEGV may be delivered
      ↓
Program stops
      ↓
GDB
      ↓
bt
      ↓
Call stack / source location
This is the real bridge between writing C code and understanding systems.
What Part 03B Has Really Added
Part 03 taught you how to read and write basic C programs.
Part 03B takes that understanding underneath the source code.
You have now seen:
- what GCC actually does
- how preprocessing differs from compilation
- how assembly and object files fit into the build
- why linking exists
- why an executable is different from a process
- what virtual memory means
- why physical RAM is not the same as a process's address space
- what the MMU and page tables do at a high level
- how Linux exposes process memory mappings
- what stack and heap mean conceptually
- what storage duration means
- how executable sections can be inspected
- how dynamic memory is allocated and released
- why allocation failure must be checked
- why memory leaks and dangling pointers happen
- why
free()does not make an old pointer valid - how invalid memory access can reach the operating system
- why a page fault is not automatically a segmentation fault
- how GDB can show the call stack after a crash
- how multiple C source files become one executable
Most importantly, you should no longer see a C program as only:
source code → outputA better mental model is:
Source
  ↓
Translation
  ↓
Executable
  ↓
Process
  ↓
Virtual Memory
  ↓
CPU + MMU + OS
  ↓
Program Behaviour
That is the foundation on which the deeper parts of C are built.
Where We Go Next
The next parts of the C Master Series will build on this foundation.
You will move from understanding how a C program works internally to using that understanding to write more capable programs.
That means working with:
- variables in greater depth
- data types
- formatted input and output
- operators
- conditions
- loops
- arrays
- strings
- functions
- pointers
- memory
- structures
- files
- and eventually complete practical projects
The objective is not to memorise isolated C syntax.
The objective is to understand what your code is asking the computer to do, how that request is translated, how the program executes, and how the different layers connect.
Once that mental model is clear, C stops looking like a collection of difficult symbols.
It starts looking like a system you can reason about.
Explore • Research • Test • Build • Explain.